9
Response of fiber hemp (Cannabis sativa L.) to varying irrigation regimes
Shaun Lisson1 and Neville Mendham2
1CSIRO, Davies Laboratory, University Drive, Aitkenvale, Queensland 4814, Australia
2Department of Agricultural Science, University of Tasmania, Hobart, Tasmania 7001, Australia
Lisson, Shaun and Neville Mendham 1998. Response of fiber hemp (Cannabis sativa L.) to varying irrigation regimes. Journal of the International Hemp Association 5(1): 9-15. This paper reports on the findings from a hemp (Cannabis sativa L.) irrigation trial conducted on a krasnozem soil in northwest Tasmania, Australia in 1995/96. Studies were made of crop growth, development and water use responses to rainfed and irrigated treatments with allowable soil water deficits of 30, 60, 90 and 120 mm. At final harvest, the stem yield and total dry matter of the irrigated treatments were not significantly different, but each yielded more than the rainfed treatment. The percentage of bark in the stem appeared to decline with deficit to irrigation. When translated into bark yield at final harvest, the 30 mm and 60 mm deficit treatments yielded significantly more bark than the remaining treatments. Similarly, the 90 mm and 120 mm treatments were higher yielding than the rainfed treatment. Soil water extraction was primarily confined to the upper 80-90 cm of the soil profile, with little extraction at greater depths. In the rainfed treatment, there was evidence of minor extraction down to at least 140 cm. Water consumption (to 90 cm) ranged from 359 mm for the rainfed treatment, to 535 mm for the 60 mm treatment. Water use efficiency ranged from 2.4 g/kg for the 90 mm treatment to 3.1 g/kg for the 120 mm treatment.
Introduction
Literature recommendations
for the water requirements of fiber hemp are sparse and somewhat ambiguous. In
the Ukraine, optimum yields are achieved with 250-280 mm of rainfall during the
growing season (P. Goloborodko. pers. comm. 1994). Begg and Buller (1995)
suggest a total available water requirement of approximately 600 mm. Van Dam
(1995) reports that hemp requires rainfall of at least 650 mm per year.
Preliminary field trials with hemp in
Tasmania indicated that irrigation would be essential in order to overcome
deficiencies in both the distribution and the total amount of rainfall over the
summer months (Lisson 1998). Areas of a hemp trial conducted in 1994/95 that
received insufficient water were severely stunted and gave poor stem and fiber
yields in comparison to well-watered sites. Furthermore, a growth model
developed by Hackett (1991) identified rainfall shortages as a major limitation
to hemp growth in three separate locations across southern Australia.
The purpose of this trial was to
examine the effect of a range of allowable soil water deficits on the yield and
growth responses of hemp (cv. Kompolti). Sequential harvest data enabled
examination of the ability of fiber hemp to recover from periods of water
stress. Regular measurements of soil water content with a neutron moisture meter
were used to develop soil water extraction profiles and to calculate seasonal
water consumption and water use efficiency.
| Treatment: | Number: | Dates (1995-96): |
|---|---|---|
| 30mm (I30) | 8 | 27.10/ 21.11/ 4.12/ 11.12/ 14.12/ 24.12/ 10.1/ 17.1 |
| 60mm (I60) | 4 | 21.11/ 4.12/ 24.12/ 17.1 |
| 90mm (I90) | 2 | 4.12/ 24.12 |
| 120mm (I120) | 2 | 11.12/ 17.1 |
| Rainfed (I0) | 0 | - |
Materials and methods
Design & treatments-
A randomized complete block design
was employed with four replicates. Each plot was 1.6 m wide and 10 m long. A
buffer zone (cv. Kompolti) of one plot width was sown around the perimeter of
the trial area.
The five irrigation treatments
covered a range of soil moisture deficits including 30 mm (I30), 60
mm (I60), 90 mm (I90), 120 mm (I120) and a
rainfed treatment (I0). The number and dates of irrigations are shown
in Table 1. Deficits were based on cumulative, rainfall-adjusted Class A pan
evaporation measurements made within 500 m of the trial site. Upon reaching the
treatment deficit, each of the four replicate plots was returned to field
capacity.
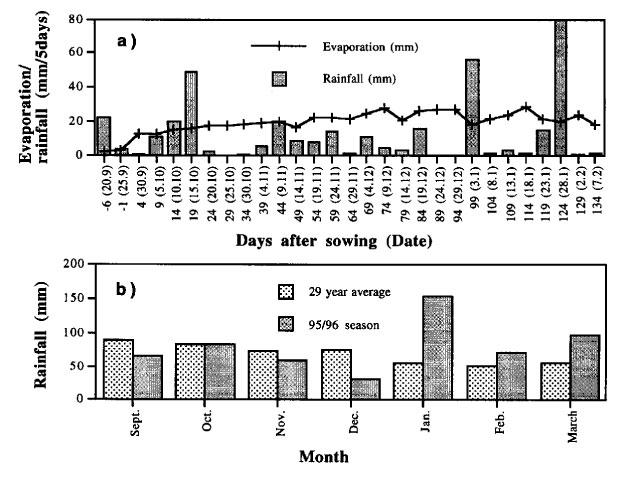
Total rainfall for the duration of
the trial was approximately 60 mm above the average (38 year) rainfall total for
the same period (Figure 1). The distribution of rainfall was less favorable,
with lower than average rainfall totals for the months of November and
especially December. Over twice the average rainfall was received in January.
Figure 1. (a) Total rainfall and Class A pan evaporation for five day periods (days after sowing and date (bracketed) along the X axis) from 20/9/95 to 7/2/96. (b) Monthly average rainfall totals from 1958-1996 and 1996-97 season monthly totals.
Cultural methods-
Seed of the cultivar 'Kompolti' was sown to a depth
of approximately 3-4 cm, using a 10 row cone seeder with 13.5 cm row spacing and 1.6 m plot centers. The entire
trial area was sown at a seeding rate of 80 kg/ha, to establish a plant density of 150 plants/m 2 .
The trial was sown on September 26, 1995 at the
Forthside Research Station (41°10S, 146°40E) on a krasnozem soil. This soil is classified as a reddish brown,
strongly structured, gradational, clay loam to clay soil. The amount of useful water held in these soils types at
field capacity down to a depth of 70 cm, is typically moderate at 10-15% (Bridge and Bell 1994, Chilvers
1996). Leeper and Uren (1993) report that these soils are susceptible to drought but their structure is such that roots
are able to penetrate deep into the profile to reach greater reserves of water.
Irrigation was applied with Netafim flexible
polyethylene drip tubing operated at a water pressure of 100 kPa and a delivery rate of 1.75 liters per hour per drip
point. Four lengths of the flexible tubing were positioned along each plot at 30 cm spacing. Each set of treatment
replicates were fed by a 19 mm polyethylene pipe which, in turn, was connected to a common 25 mm polyethylene
pipe via an isolating tap.
Fertilizer rates were based on a soil test and
literature recommendations for hemp production (100-130 kg N/ha, 35-50 kg P/ha and 110-140 kg K/ha). A blend of
9:14:17 NPK fertilizer (350 kg/ha) and zinc sulfite monohydrate (30 kg/ha) was incorporated into the top 15-20 cm
of the soil profile just prior to drilling. A further top dressing of nitrogen (40 kg/ha) fertilizer was applied
4-6 weeks after sowing.
The trial area was hand weeded at ten weeks.
Thereafter, weed growth was adequately suppressed by the hemp crop.
Stem rot (Sclerotinia sclerotiorum) was apparent
on isolated plants about the time of flowering but losses were not regarded as significant.
| Harvest: | Date: | Days from sowing: |
|---|---|---|
| H1 | 5.11.95 | 40 |
| H2 | 21.11.95 | 56 |
| H3 | 11.12.95 | 76 |
| H4 | 2.1.96 | 98 |
| H5 | 16.1.96 | 112 |
| H6 | 5.2.96 | 132 |
Data collection and analysis-
Sequential harvests of 0.5 m 2 were collected at bi-weekly
intervals, allowing 0.5 m of plot length as a buffer between each sample. The final harvest of 2.0 m 2 was
collected at late flowering (Table 2). Dead and senesced leaf matter along with severely suppressed living plants (a
result of self-thinning) were not included in harvested samples.
Total above-ground fresh weight and plant counts
were measured for each sample. A random selection of 20 plants was then set aside for partition analysis and
measurement of stem length. Average leaf area (mm 2 ) was measured using a Paton/CSIRO Electronic Planimeter and
was based on a cumulative sample of approximately 40 leaves. Stem length was measured from ground level to
the top of the fruiting zone. Diameter was measured at the base of the stem. Node counts included the cotyledonary
node. Paired nodes, with alternate leaves appearing after flowering were regarded as single nodes. Partitioned sub-samples
were then oven-dried at 70°C for 48 hours to determine total dry matter and stem yield.
At final harvest, the proportion of bark in the stem
was determined from stem sections. Starting from about 15 cm above ground level, sections of approximately 30
cm in length were taken from 15 female plants. The bark was peeled away by hand and the relative proportions
calculated from oven dry weights of each separated fraction.
A neutron moisture meter (NMM) was used to
measure changes in percent volumetric soil moisture content with depth. One aluminum recording tube was
buried to a depth of 1.5 m in three replicate plots of each treatment. Moisture readings were made every 3-4 days
and averaged across the three replicates. The data were subsequently processed using a software package entitled
The Probe, developed by Neutron Probe Services Pty. Ltd.
Analysis of variance tests were performed using
Systat 5.2.1 software. Means were compared using the Fisher LSD test with significance for P values less than
0.05.
| Treatment: | I30 | I60 | I90 | I120 | I0 | LSD 0.05 |
|---|---|---|---|---|---|---|
| Plant density (plants/m2) | 120 | 114 | 107 | 127 | 125 | n.s. |
| Total D.M. (g/m2) | 1552 | 1562 | 1454 | 1484 | 1217 | 166*** |
| Stem Yld. (g/m2) | 1386 | 1379 | 1273 | 1315 | 1056 | 128*** |
| Bark percentage | 42.7 | 41.6 | 40.3 | 38.9 | 39.1 | 2.3* |
| Bark yield (g/m2) | 591 | 574 | 513 | 512 | 412 | 60*** |
| Leaf yield (g/m2) | 151 | 154 | 165 | 147 | 145 | n.s. |
| Leaf area index | 4.23 | 4.30 | 4.61 | 4.12 | 4.01 | n.s. |
| Node number | 15.7 | 15.9 | 15.7 | 16.4 | 15.3 | n.s. |
| Stem length (cm) | 249 | 250 | 237 | 247 | 228 | 14* |
| Stem diameter (mm) | 10.8 | 11.2 | 10.6 | 10.4 | 9.6 | n.s. |
Results
Final harvest results are listed in Table 3.
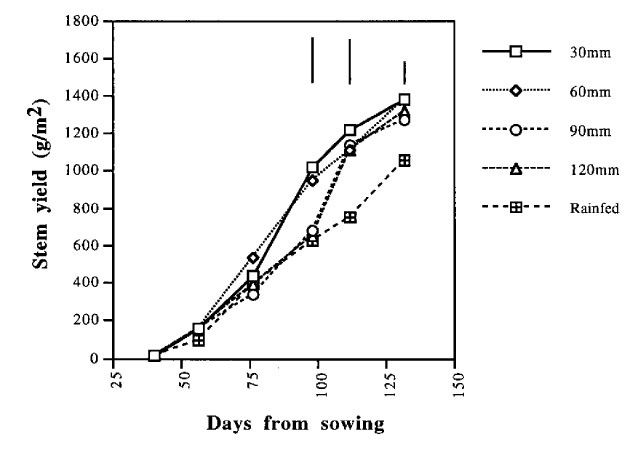
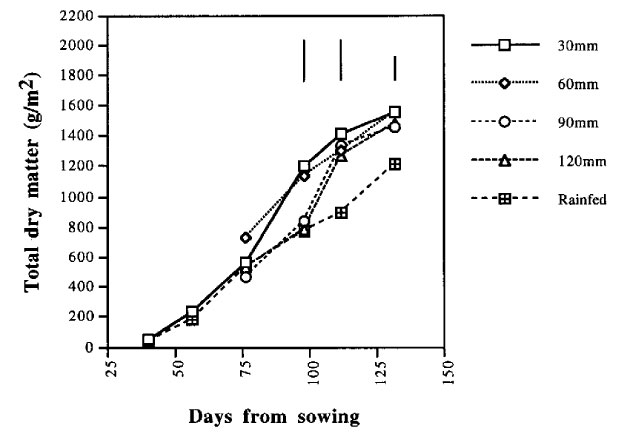
Figure 2. Time responce plot for total dry matter. The bars correspond to Fisher LSD values (P<0.05) for the final three harvests.
Time responce plot for stem yield. The bars correspond to Fisher LSD values (P<0.05) for the final three harvests.Figure 3.
Yield and yield components-
Significant treatment differences were apparent for
total dry matter and stem yield in the fourth, fifth and final harvests (Table 3, Figures 2 and 3).
Significant treatment differences were first
apparent at Harvest 4 (day 98), with the total and stem dry matter yield of I30 and I60 exceeding those of the
remaining treatments. There was an apparent delay in the response of I90 (1st irrigation on day 69) and I120 (1st
irrigation on day 76) treatments to irrigation, with total dry matter and stem yield similar to that of the rainfed
treatment at Harvest 4 (98 DAS, Figures 2 and 3).
Following Harvest 4, the growth rates associated
with I90 and I120 increased sharply, so that at Harvests 5
and 6, the stem yield and total dry matter of the irrigated treatments were not significantly different, but each yielded
more than the rainfed treatment. This increase in growth rate coincided with substantial rainfalls and higher
temperatures in early January.
The percentage of bark in the stem appeared to
decline with deficit to irrigation (Table 3). The I30 and I60
treatments had significantly higher bark percentages than the I120 and rainfed treatments. Similarly, I30 had a higher
proportion than I90.
When translated into bark yield at final harvest, I30
and I60 yielded significantly more bark than the remaining treatments. Similarly, I90 and I120 were higher yielding
than the rainfed treatment.
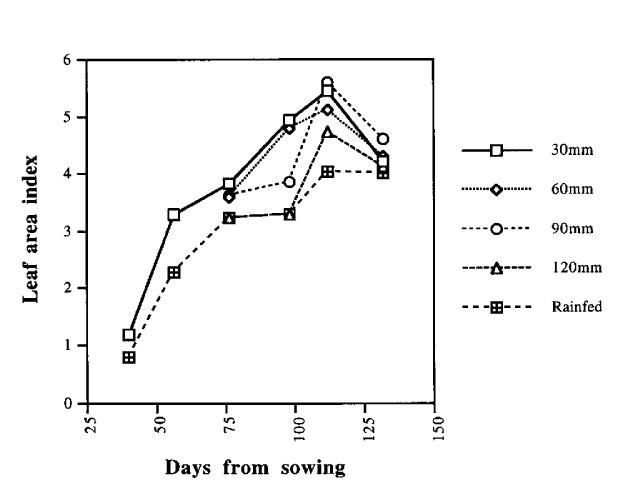
Time responce plot for leaf area index.Figure 4.
Leaf area production-
There were no significant differences between
treatments for leaf area index (LAI) or leaf yield at any of the harvests (Table 3, Figure 4). However, LAI for the 30
mm treatment was consistently greater than the rainfed treatment at all harvests. Furthermore, prior to flowering
and the subsequent increase in leaf senescence (especially from male plants), LAI tended to decline with increased
deficit.
While there was no apparent trend in node number
across the irrigated treatments at each harvest, the node number for the rainfed treatment was consistently less
than that for the irrigated treatments (final harvest data shown in Table 3).
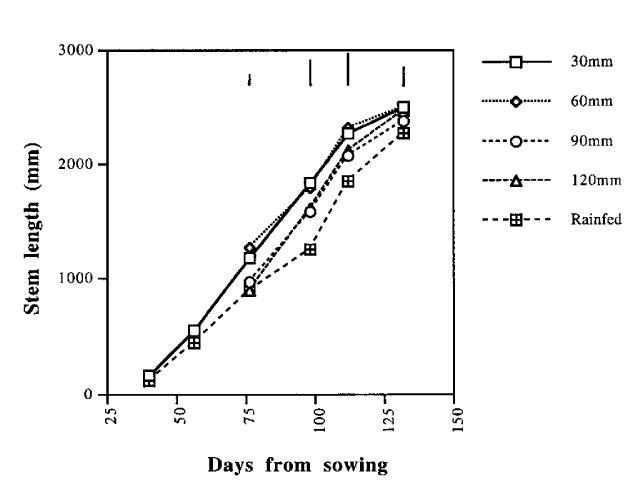
Figure 5. Time responce plot for stem length. The bars correspond to Fisher LSD values (P<0.05) for the final four harvests.
Stem length-
Significant treatment differences were apparent for
stem length in Harvests 3, 4, 5 and 6 (Table 3, Figure 5). The response to irrigation was readily apparent at Harvest
3, with I30 and I60 significantly taller than the recently
irrigated I90 and unirrigated I120 and rainfed treatments. At
Harvests 5 and 6, the irrigated treatments were not significantly different in height but were all taller than the
rainfed treatment. This response resembles the response of total dry matter and stem yield.
Flowering-
The time of flowering was taken as the 15th of
January (112 days after sowing). There was no apparent difference between treatments.
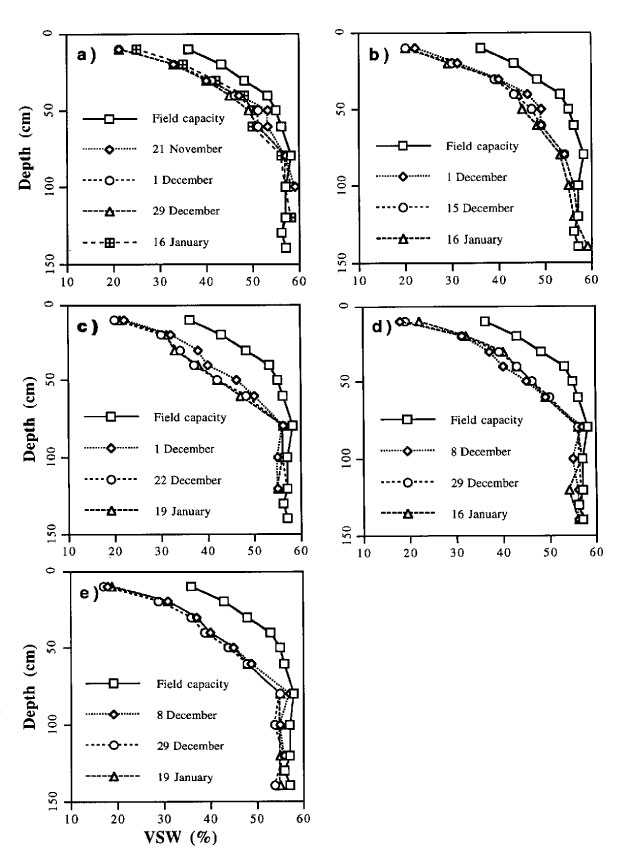
Patterns of volumetric soil water content (%) with depth, at selected dates and at field capacity, for treatments: I30 (a), I60 (b), I90 (c), I120 (d), I0 (e).Figure 6.
Soil water extraction-
Figure 6 shows patterns of volumetric soil water
content (VSW%) recorded just prior to irrigation or rain-fall events that returned the profile back to field capacity.
These represent the maximum extent of crop water extraction for each irrigation treatment. The pattern
corresponding to field capacity is also shown.
Across all treatments, soil water extraction was
primarily confined to the upper 80-90 cm of the soil profile, with little extraction at greater depths. In the
rainfed treatment, there was evidence of minor extraction down to at least 140 cm. The distribution of water
extraction in three zones down to 100 cm (0-35, 35-55 and 55-100), averaged over the patterns selected for Figure 6,
are shown in Table 4. The decline in total water content for each depth interval is expressed as a percentage of the
water content at field capacity. With the exception of the 60 mm treatment, extraction decreased with increasing
soil depth. This decrease appeared greatest for the 30 mm treatment, with just under two thirds of the water extracted
from the upper 35 cm of the profile. This may be attributable to a proliferation of roots in response to more
frequent irrigation. In the other treatments, extraction appeared to shift into the 35 to 55 cm zone and, to a lesser
extent, into the 55 to 100 cm zone.
| Irrigation treatment: |
|||||
|---|---|---|---|---|---|
| I30 | I60 | I90 | I120 | I0 | |
| Depth zone (cm): | |||||
| 0-35 | 63 | 53 | 51 | 57 | 56 |
| 35-55 | 22 | 23 | 30 | 28 | 27 |
| 55-100 | 15 | 24 | 19 | 15 | 17 |
Seasonal water received, water consumption and water use efficiency-
The total amount of water received by each
treatment is shown in Table 5. This total is the sum of rainfall and irrigation, discounted for losses through runoff
when the amount of rainfall exceeded the prevailing deficit. This loss was most prevalent with the more
frequently irrigated treatments, as reflected by the similar totals for the 30, 60 and 90 mm deficit treatments. The
greatest amount of water was received by the 60 mm treatment and the lowest by the rainfed treatment.
The change in water content between two NMM
readings to a certain depth plus any intervening rainfall or irrigation amounts (discounted for runoff), gives a
measure of the water consumed over that period. A sum of these periodic totals over the duration of the growing
season gives the total water consumed. Seasonal water consumption to a depth of 90 cm is shown in Table 5. In
the period between sowing and the first NMM reading, evapotranspiration was assumed equivalent to Class A
pan evaporation. Dividing the mean stem dry weight by the total amount of water consumed through
evapo-transpiration, gives a measure of the water use efficiency for stem production (Table 5).
Similar water use efficiencies of about 3 g/kg were
obtained for the 30 mm, 120 mm and rainfed treatments, with lower values for the 60 mm and 90 mm treatments.
The high values for the two driest treatments may indicate that the roots reached a greater depth and were able to
extract stored water lower in the profile. It may also indicate that water was used more economically due to
stomatal closure during periods of water stress (Salisbury and Ross 1985).
| Treatment: | Effective rain + irrigation (mm): |
Water consumed to 90cm (mm): |
Water use efficiency (g.kg Water): |
|---|---|---|---|
| 30mm | 419 | 468 | 3.0 |
| 60mm | 440 | 535 | 2.6 |
| 90mm | 429 | 524 | 2.4 |
| 120mm | 348 | 422 | 3.1 |
| Rainfed | 277 | 359 | 2.9 |
Discussion
Significant stem yield differences were not apparent for irrigation regimes based on refill to field
capacity at deficits down to 120 mm. Seasonal water consumption for this regime was approximately 420 mm.
Maximum bark yield was obtained from regimes based on a 60 mm deficit or less (water consumption of 535 mm).
The significant decline in stem bark content with increasing deficit has previously been observed for kenaf
(Hibiscus cannabinus L.) by Muchow and Wood (1980).
Whilst the yield of the rainfed treatment was
reasonable, lower stem yields might be expected under average weather conditions at Forthside, when the
seasonal rainfall total is less and January rainfall is less than half that received in this trial. In the absence of the
large rainfall event in January, the stem yield (Figure 3) for the rainfed treatment was likely to have only reached
around 800-900 g/m 2 .
Begg and Turner (1976) report that a reduction in
leaf area is a major morphological consequence of water stress. This is primarily brought about through a
reduction in cell division and more importantly, a lessening in the rate of cell enlargement. Although
differences between leaf area indices across the five treatments were not significant, there was evidence of
a declining trend with increasing deficit. Across the irrigated treatments, this was most likely attributable to
a decline in area per leaf rather than a decline in leaf (node) or plant number. A decline in leaf number may
have contributed to the decline in leaf area between the irrigated and rainfed treatments.
Interestingly, there was a notable delay in the
response of leaf area and dry matter production to the first irrigations for the 90 mm and 120 mm treatments.
Eventually however, the growth rate increased sharply so that at Harvests 5 and 6, differences between the
irrigated treatments for yield and total dry matter were insignificant. This increase coincided with an increase in
leaf area index. Begg and Turner (1976) report that a delay in the opening of stomata and the recovery of
photosynthesis following alleviation of water stress, has been observed in a number of other species. Increases in
growth rate following watering of previously stressed plants have been reported for tomato (Gates 1955) and
kenaf (Muchow and Wood 1980). Ludlow (1975) and Ng
et al. (1975) concluded that water stress suspended the aging of physiologically young leaves and that upon
rewatering, the photosynthetic rates of surviving leaves was greater than leaves of the same chronological age, but
comparable to those of the same physiological age.
References
|
|
|
|||||||||||||||||||||